
2026 Federal Income Tax Brackets All Filing Statuses
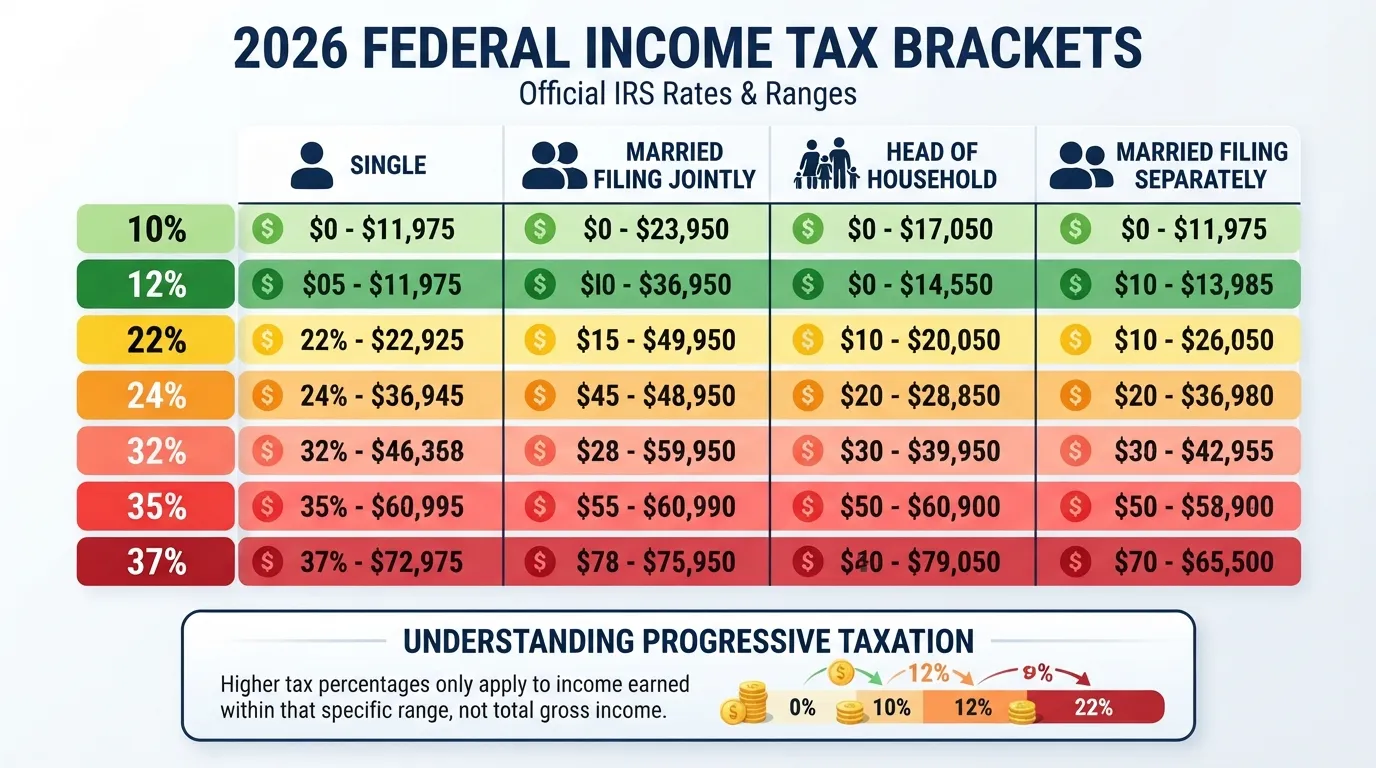
The IRS has released the official 2026 federal tax brackets, and if you're trying to figure out how much you'll owe — or how much you can save — this guide breaks it all down. Official rates and inflation parameters are maintained by the IRS and regularly analyzed by policy groups like the Tax Foundation. There are still seven tax rates: 10%, 12%, 22%, 24%, 32%, 35%, and 37%, but the income thresholds have shifted upward for inflation, meaning many filers will keep more of their income taxed at lower rates in 2026.
Below, you'll find complete bracket tables for every filing status — Single, Married Filing Jointly, Head of Household, and Married Filing Separately — along with the 2026 standard deduction, capital gains brackets, and a clear explanation of how marginal and effective tax rates actually work.
Want your exact number instead of doing the math yourself? Skip ahead to our free 2026 Paycheck Calculator below and get your estimated tax in seconds.
2026 vs 2025 Tax Brackets — What Changed
While the statutory marginal tax percentages remain identical (ranging from 10% to 37%), the dollar cutoffs for every bracket expanded by roughly 2.3% to 2.8% compared to 2025. What does this mean in real dollars? If your income remained flat from last year, a larger portion of your wages falls into lower tax brackets, resulting in a small automatic reduction in your annual federal tax bill.
Why Brackets Shift Every Year
The IRS is legally mandated to recalculate income thresholds annually using the Chained Consumer Price Index (C-CPI-U). This mechanism prevents "bracket creep" — an unfair scenario where inflation-adjusted cost-of-living raises inadvertently push workers into higher marginal tax brackets even though their real buying power hasn't increased.
Single Filers — 2026 Brackets
For single taxpayers, the 10% bottom bracket now covers taxable income up to $12,400. Top-earning single filers won't hit the maximum 37% marginal rate until their taxable income exceeds $640,600.
| Tax Rate | 2026 Taxable Income Range (Single) |
|---|---|
| 10% | $0 to $12,400 |
| 12% | $12,401 to $50,400 |
| 22% | $50,401 to $105,700 |
| 24% | $105,701 to $201,775 |
| 32% | $201,776 to $256,225 |
| 35% | $256,226 to $640,600 |
| 37% | Over $640,600 |
What this means for you: A single worker earning $60,000 in taxable income will see $12,400 taxed at 10%, $38,000 taxed at 12%, and only the remaining $9,600 taxed at 22%. You do not pay 22% on your entire $60,000 salary.
Married Filing Jointly — 2026 Brackets
Married couples filing a combined return receive bracket ranges that are exactly double those of single filers across almost every tier, offering substantial tax relief for dual-income households.
| Tax Rate | 2026 Taxable Income Range (Married Jointly) |
|---|---|
| 10% | $0 to $24,800 |
| 12% | $24,801 to $100,800 |
| 22% | $100,801 to $211,400 |
| 24% | $211,401 to $403,550 |
| 32% | $403,551 to $512,450 |
| 35% | $512,451 to $768,700 |
| 37% | Over $768,700 |
Head of Household — 2026 Brackets
Unmarried individuals who pay more than half the cost of keeping up a home for a qualifying dependent qualify for Head of Household status. This status provides much wider lower-bracket bounds than Single status.
| Tax Rate | 2026 Taxable Income Range (Head of Household) |
|---|---|
| 10% | $0 to $17,700 |
| 12% | $17,701 to $67,450 |
| 22% | $67,451 to $105,700 |
| 24% | $105,701 to $201,750 |
| 32% | $201,751 to $256,200 |
| 35% | $256,201 to $640,600 |
| 37% | Over $640,600 |
Married Filing Separately — 2026 Brackets
While less common, spouses filing separately have bracket thresholds set at precisely half of the Married Filing Jointly figures. This status is often chosen when separating legal liabilities or managing income-driven student loan payments.
| Tax Rate | 2026 Taxable Income Range (Married Separately) |
|---|---|
| 10% | $0 to $12,400 |
| 12% | $12,401 to $50,400 |
| 22% | $50,401 to $105,700 |
| 24% | $105,701 to $201,775 |
| 32% | $201,776 to $256,225 |
| 35% | $256,226 to $384,350 |
| 37% | Over $384,350 |
2026 Capital Gains Tax Brackets (Short-Term vs Long-Term)
When selling assets like stocks, real estate, or crypto, your tax rate depends on how long you held the asset before selling:
- Short-Term Capital Gains: Assets held for 1 year or less are taxed as ordinary income using the standard brackets shown above.
- Long-Term Capital Gains: Assets held for more than 1 year qualify for preferential rates of 0%, 15%, or 20%.
| Rate | Single | Married Jointly | Head of Household |
|---|---|---|---|
| 0% | $0 to $49,450 | $0 to $98,900 | $0 to $66,200 |
| 15% | $49,451 to $545,500 | $98,901 to $613,700 | $66,201 to $579,600 |
| 20% | Over $545,500 | Over $613,700 | Over $579,600 |
How This Differs From Ordinary Income Brackets
Long-term capital gains rates are significantly lower than ordinary income rates. For instance, a single filer earning $80,000 in salary falls into the 22% marginal bracket for ordinary wages, but profits from long-term stock sales at that same income level are taxed at only 15%. Note: High-income investors may also owe an additional 3.8% Net Investment Income Tax (NIIT).
2026 Standard Deduction Amounts
The standard deduction reduces your Adjusted Gross Income (AGI) before any tax bracket math is applied. For 2026, the standard deduction amounts are:
- Single / Married Filing Separately: $16,100 (up $350 from 2025)
- Married Filing Jointly: $32,200 (up $700 from 2025)
- Head of Household: $24,150 (up $525 from 2025)
Additional Deduction for Age 65+ or Blind Taxpayers
Taxpayers who are 65 or older, or legally blind, receive an additional standard deduction boost:
- Single or Head of Household: Additional $2,050 per qualifying condition.
- Married (Joint or Separate): Additional $1,650 per qualifying spouse, per condition.
Example: A married couple filing jointly where both spouses are 65+ receives a total standard deduction of $35,500 ($32,200 base + $3,300 additional) for 2026.
Federal Tax Withholding Tables 2026
If you receive a regular paycheck, your employer doesn't wait until tax season to collect taxes — they use IRS withholding tables based on your Form W-4 to estimate and deduct federal tax from every pay period.
Withholding vs. Actual Tax Liability
It is vital to distinguish between these two terms: Tax Liability is the exact, legal total tax calculated on your annual tax return (Form 1040). Withholding is merely an estimated installment payment plan toward that bill. If withholding exceeds your liability, you get a tax refund; if it falls short, you owe a payment.
How Employers Use These Tables
Employers utilize IRS Publication 15-T computational rules. Your payroll system multiplies your paycheck earnings by your yearly pay periods, subtracts standard allowances indicated on your W-4, calculates the yearly tax using the 2026 bracket schedule, and divides that tax back across your individual paychecks.
Marginal vs Effective Tax Rate — How Your Tax Is Actually Calculated
The single biggest mistake taxpayers make is assuming that hitting a higher tax bracket means all their income gets taxed at that rate. That is false. The US uses a progressive tax system where income is taxed in ascending tiers.
Your Marginal Tax Rate is the top rate applied to your very last dollar of income. Your Effective Tax Rate is the actual average percentage of your overall income paid in tax (Total Tax ÷ Total Taxable Income).
Example Calculations ($100,000 Taxable Income Comparison)
Here is exactly how three different filers, each earning $100,000 in Taxable Income in 2026, calculate their total federal tax owed:
1. Single Filer ($100,000 Taxable Income):
- First $12,400 at 10% = $1,240.00
- Next $38,000 ($12,401 to $50,400) at 12% = $4,560.00
- Remaining $49,600 ($50,401 to $100,000) at 22% = $10,912.00
- Total Tax Owed: $16,712.00
- Marginal Rate: 22% | Effective Rate: 16.71%
2. Married Filing Jointly ($100,000 Taxable Income):
- First $24,800 at 10% = $2,480.00
- Remaining $75,200 ($24,801 to $100,000) at 12% = $9,024.00
- Total Tax Owed: $11,504.00
- Marginal Rate: 12% | Effective Rate: 11.50%
3. Head of Household ($100,000 Taxable Income):
- First $17,700 at 10% = $1,770.00
- Next $49,750 ($17,701 to $67,450) at 12% = $5,970.00
- Remaining $32,550 ($67,451 to $100,000) at 22% = $7,161.00
- Total Tax Owed: $14,901.00
- Marginal Rate: 22% | Effective Rate: 14.90%
Calculate Your Exact 2026 Paycheck & Tax Owed
Enter your exact salary, state, and filing status into our free tax engine to see your net take-home pay and tax breakdown instantly.
Calculate Your 2026 Taxes NowFrequently Asked Questions
What will the standard deduction be in 2026?
In 2026, the standard deduction is $16,100 for Single filers, $32,200 for Married couples filing jointly, and $24,150 for Head of Household filers.
What are the new tax brackets for 2026 vs 2025?
The rate percentages stay at 10%, 12%, 22%, 24%, 32%, 35%, and 37%. However, the dollar thresholds for each bracket increased by approximately 2.3% to 2.8% to adjust for inflation.
What are the federal tax withholding tables for 2026?
They are IRS operational schedules (IRS Pub 15-T) used by payroll providers to calculate exact tax withholdings per paycheck based on filing status and Form W-4 elections.
Will federal taxes go down in 2026?
If your salary stays constant, your federal income tax will be slightly lower in 2026 because expanded brackets and standard deductions reduce your taxable income exposure.
What is the federal tax rate for $100,000 a year?
A single filer earning $100,000 in taxable income falls into the 22% marginal tax bracket, but their overall effective tax rate is only 16.71% ($16,712 total tax) due to progressive lower brackets.
What is the single filer tax rate for 2026?
Single filers do not pay a flat rate; they pay progressive rates starting at 10% (up to $12,400) and moving through 12%, 22%, 24%, 32%, 35%, up to a top rate of 37% on income over $640,600.
What is the "60% trap"?
The "60% trap" describes a scenario where earning an extra dollar causes a taxpayer to lose tax credits or benefits (like the Child Tax Credit or student loan deductions) while simultaneously paying higher marginal federal, state, and payroll taxes—creating a combined effective marginal tax rate near 60% on that income slice.
When will 2027 tax brackets be announced?
The IRS typically releases official inflation-adjusted tax brackets for the upcoming 2027 tax year in late October or early November of 2026 via an official Revenue Procedure announcement.
Explore Related Tax Resources:
📌 Related Articles You Might Like
$14 An Hour Is How Much A Year After Taxes
https://payscheckcalculator.com/blog/14-an-hour-is-how-much-a-year-after-taxes/
Visit This Blog →What To Do With Your First Paycheck As A Teenager
https://payscheckcalculator.com/blog/what-to-do-with-your-first-paycheck-as-a-teenager/
Visit This Blog →How Much Should I Save Per Paycheck Calculator
https://payscheckcalculator.com/blog/how-much-should-i-save-per-paycheck-calculator/
Visit This Blog →Pre-Tax Vs Post-Tax Deductions
https://payscheckcalculator.com/blog/pre-tax-vs-post-tax-deductions/
Visit This Blog →When Will I Get My First Paycheck Calculator
https://payscheckcalculator.com/blog/when-will-i-get-my-first-paycheck-calculator/
Visit This Blog →
Written & verified by Daniel R. Whitmore
Founder & Developer, PayCheckCalculator.com
Last updated: July 2026
0 Comments